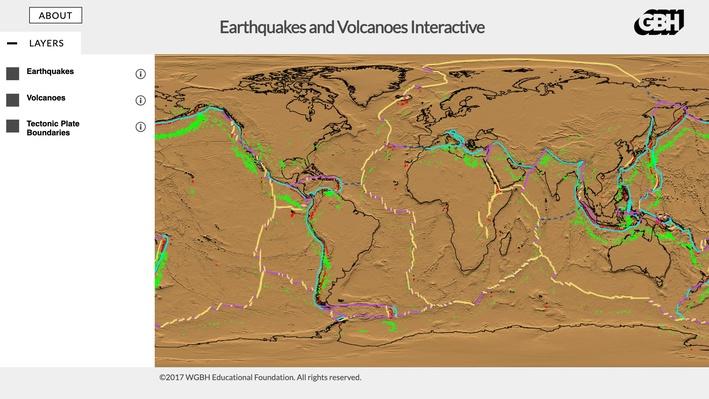
Earthquakes and Volcanoes Interactive
Resource Description
Related Resources

Electoral Decoder | Interactive Map
Use this interactive map to explore the past 59 presidential elections (1789–2020). Learn about the significance of the Electoral College by comparing the map and the electoral cartogram. Delve further into history by reading a brief overview of the Electoral College and the role of electors and looking at key events in past elections. Then, use the "Presidential Predictor" to see how a candidate might win the electoral vote in the next election. How would you strategize a political campaign to win the presidency?

The Brain with David Eagleman | Interactive
What's the story of one of our body's most complex organs? In this interactive, viewers can explore clips from each of the six episodes of The Brain with David Eagleman. Whether hoping to understand how the brain develops or how it perceives the world around us, viewers can gain a deeper understanding of who we are and who's in control.

South America Interactive Map
In this interactive map produced by WGBH, explore the continent and countries of South America. Through political, physical, population, and climate map layers and individual country views, learn about the boundaries that define the continent's 12 sovereign states and one overseas region, the geologic features that shape its landscape, and the people who inhabit its urban centers and remote villages. Note: Population figures are from approximately 2012.